Six ways to tell the same project — from a single sentence for someone who knows nothing, to the formal architecture for an ICAD reviewer. All describe the same central idea: moving from a black box to an auditable process.
Y = g(X) + R — RMA audits whether R still contains structure
The question that starts everything
What information from a painting remains when we turn it into a sonic experience?
A painting has many measurable properties: color distribution, chromatic variation, spatial complexity, edges, texture, fractal structure, region organization. The ARGIRA pipeline takes those visual characteristics and transforms them into acoustic parameters: frequency, timbre, harmonics, modulation, rhythm, spatialization.
But a deeper scientific question emerges: when an image goes through a visual → acoustic transformation, what part of its structure is still present and can be recovered? That's where RMA comes in.
What is RMA?
RMA stands for Residual Model Auditor. If we have a transformation:
Image → ARGIRA → Sound
we can build models that try to explain the result:
Visual characteristics → Acoustic parameter
The model explains a part. But a residual remains:
Residual = actual result − explained result
The RMA question is always the same: does the residual still contain structural information?
no structure the model explains the relationship well.
predictable there is information that the model didn't capture.
This allows us to study the real limitations of the mapping, not just its predictive capacity.
The Explorer
The self-contained HTML is an interface for exploring this entire system. It is not just a visualization: it is a research layer that connects the pipeline, data, evidence, hypotheses, and analyses.
SCREENSHOT — Explorer welcome screen
General view of the HTML opened in a browser, showing the set of tabs (Network, Inspector, Evidence, Research, Analysis).
What makes ARGIRA ↔ RMA special?
It is not just about "a painting produces a sound" — that would already be sonification. The deeper question is:
What structure survives when an artistic representation changes domain?
ARGIRA studies the translation. RMA studies the information that remains after that translation. The Explorer brings both together in an instrument where you can see, analyze, and audit the entire process.
For the poster presentation · ICAD 2026
The two-minute version
ARGIRA ↔ RMA is a research instrument that studies what happens when we transform a painting into sound.
ARGIRA is a sonification pipeline: it extracts visual features from an image —such as color distribution, spatial complexity, edge density, or fractal dimension— and converts them into acoustic parameters, creating a sonic representation of the artwork.
But the main question is not just how to generate a sound from an image. The question is:
What information from the image remains after that transformation?
To study this I developed RMA, Residual Model Auditor. RMA analyzes the relationship between the input visual features and the output acoustic parameters, also examining the information left in the model residuals. If recoverable structure remains after explaining the mapping, it means there is information that the transformation has not fully captured.
The ARGIRA ↔ RMA Knowledge Explorer brings this entire process together in a self-contained web application. It allows you to visualize the dependency network between visual features and acoustic parameters, inspect the provenance of each variable, separate validated evidence from exploratory hypotheses, and run reproducible analyses directly in the browser.
Anchor phrase for the presentation: moving from a black box —an image goes in and a sound comes out— to an auditable process where we can study what is preserved, what is lost, and what new structures might emerge during a translation between domains. This is the conceptual leap from ARGIRA to RMA — worth emphasizing.
ARGIRA is not just a sonification system. It is a platform for investigating the relationship between visual representation, sound, and structural information.
Póster ARGIRA — ICAD 2026, 31st International Conference on Auditory Display (28–31 julio 2026)
Versión impresa/digital real del póster presentado. Incluye el resumen de correlaciones (hue_std → Ds, r=0.887, N=45; ampliado a N=74, r=0.923), las extensiones post-revisión y el QR al póster interactivo.
Presentación oral extendida · ICAD 2026
The ten-minute version
1. Introduction: the research question
ARGIRA arises from a simple but profound question:
What happens to the information in an image when we transform it into sound?
A painting contains multiple levels of information: color, spatial distribution, texture, complexity, organization of shapes and patterns. A sonification converts some of these visual characteristics into acoustic parameters.
In ARGIRA, an image is not translated directly into a sound in an arbitrary way. First, quantifiable visual features are extracted, and these then feed a pipeline that generates acoustic parameters: certain properties of color, spatial structure, or visual complexity can influence frequency, timbre, rhythm, modulation, or spatialization.
But the more interesting scientific question appears afterward, once the image has already changed domains: what information remains?
Does the sound retain structure from the original image?
Is there information that gets lost?
Are there relationships that the initial mapping does not fully explain?
To answer these questions I developed RMA: Residual Model Auditor.
2. From visual-acoustic mapping to residual auditing
A sonification system can be seen as a function:
Image → ARGIRA → Acoustic parameter
We can try to explain that relationship through statistical models. The model learns part of the transformation:
Visual features → Expected acoustic outcome
But there is always a difference between the observed value and the predicted value. That remainder is the residual. RMA studies precisely that residual — the question is not just "how well does the model predict?", but something deeper:
After explaining the main relationship, is there still structured information left?
no structure the model adequately captures the relationship.
predictable there is information the model is not fully representing.
This allows us to study the limitations of the mapping, not just its predictive capacity.
3. The Knowledge Explorer
To make this process transparent, I developed the ARGIRA ↔ RMA Knowledge Explorer: a self-contained web application that runs entirely in the browser. Its goal is not just to display results, but to allow inspection of the entire path from image to statistical analysis.
The architecture is divided into three main layers:
Evidence — audited results.
Research — hypothesis exploration.
Analysis — a reproducible lab.
4. Evidence: audited results
The first layer is Evidence. Here you will find only confirmed and audited results — it is a read-only layer.
The reason is methodological: an interactive tool can generate many explorations, but an exploration should not automatically become evidence. That is why Evidence remains separate. Confirmed results have a clear identity: we know where they come from, how they were obtained, and what level of validation they have.
5. Research: hypothesis exploration
The second layer is Research. This area allows you to formulate new questions, for example:
Is there an unexpected relationship between certain visual features and acoustic parameters?
Do patterns appear that deserve further investigation?
But a hypothesis is not evidence. Research allows exploration without contaminating confirmed results: a hypothesis can only move to Evidence after independent validation.
6. Analysis: the reproducible laboratory
The third layer is Analysis. Here the user can run the RMA engine directly, using:
the included corpus of 227 paintings;
or an external dataset provided by the user.
The analysis runs locally via Pyodide in the browser. This means that the results of an exploration remain in the user's session and do not modify the stored evidence. The tool allows generating reports and exporting results to continue the analysis outside the Explorer.
7. The dependency network: making the transformation visible
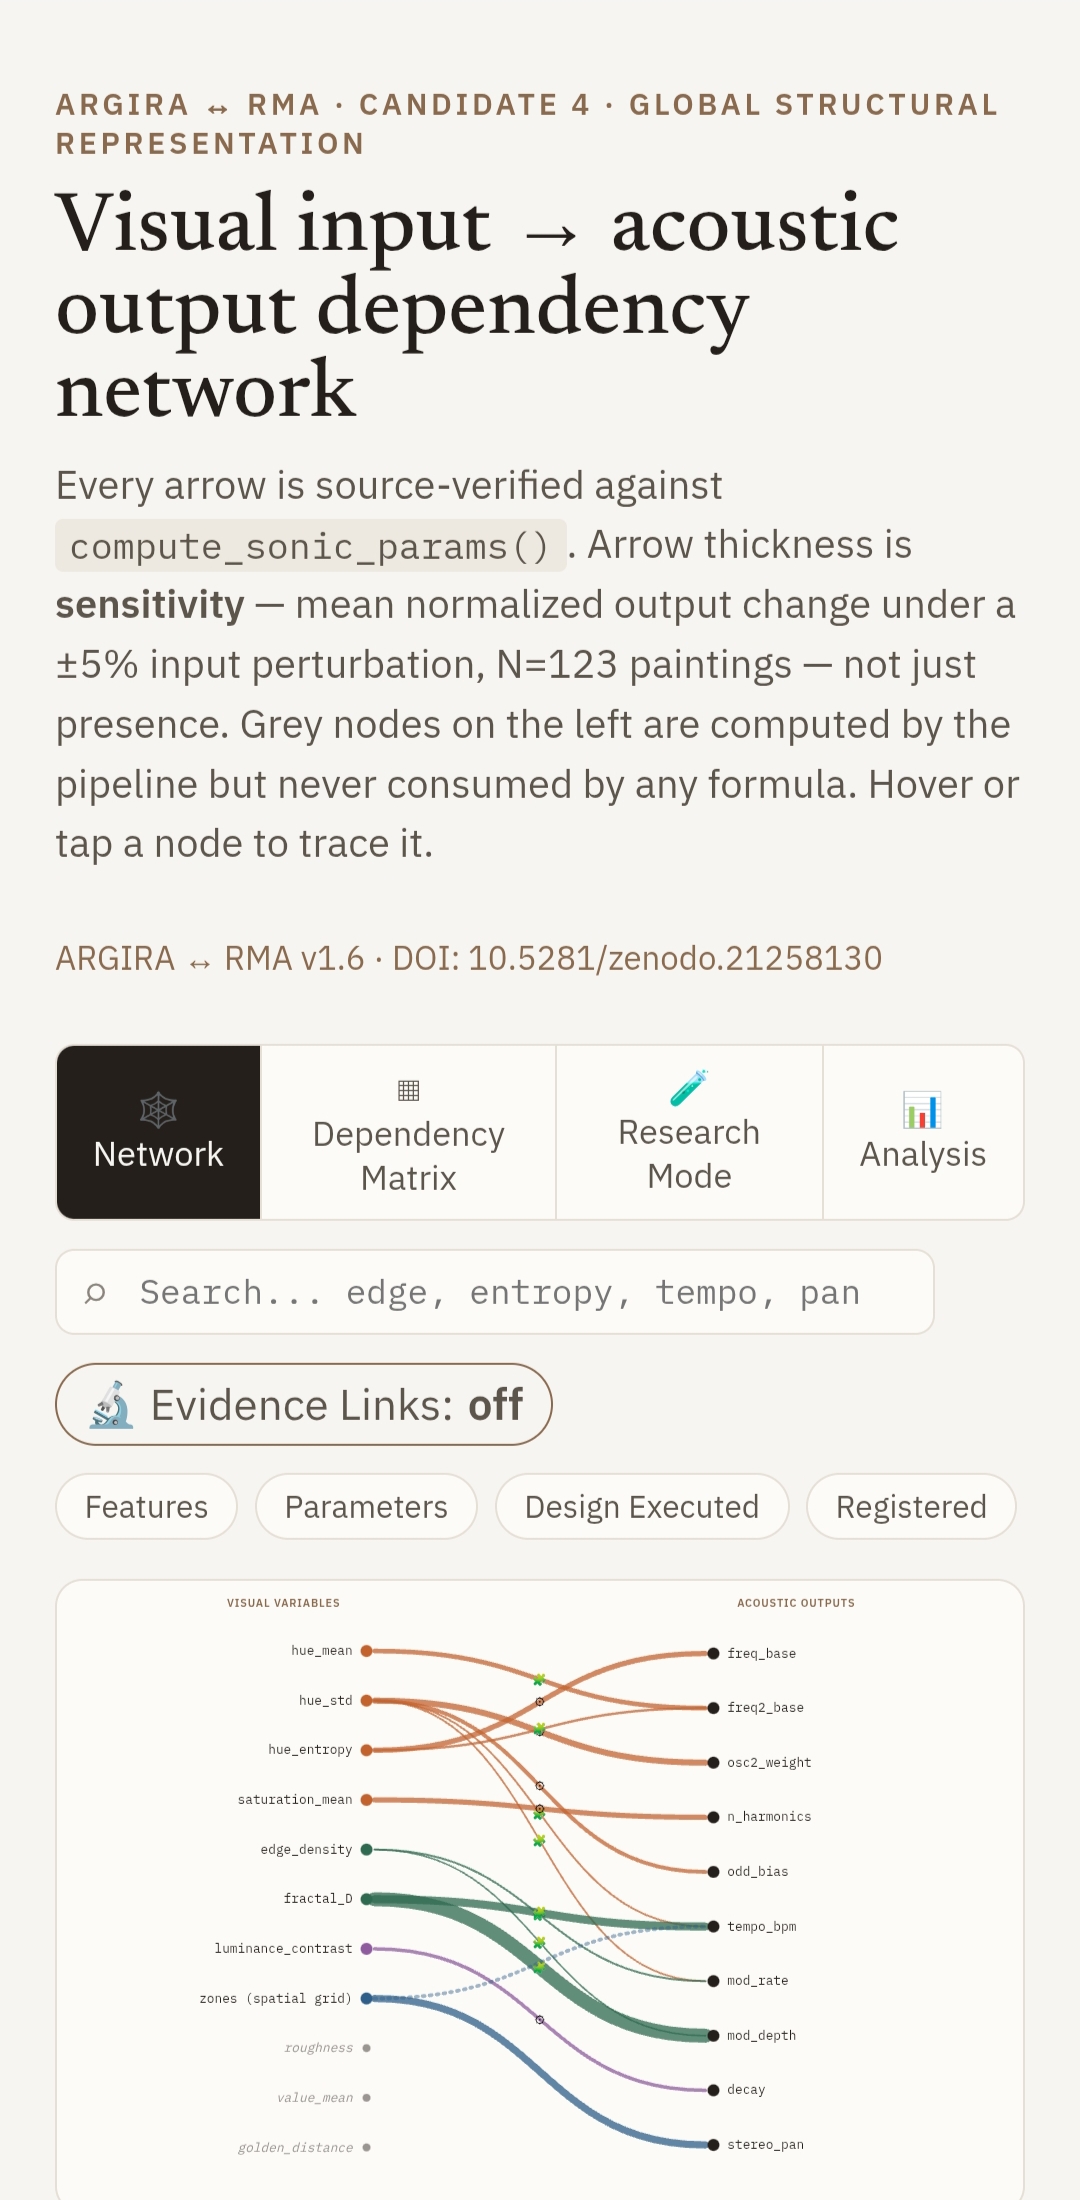
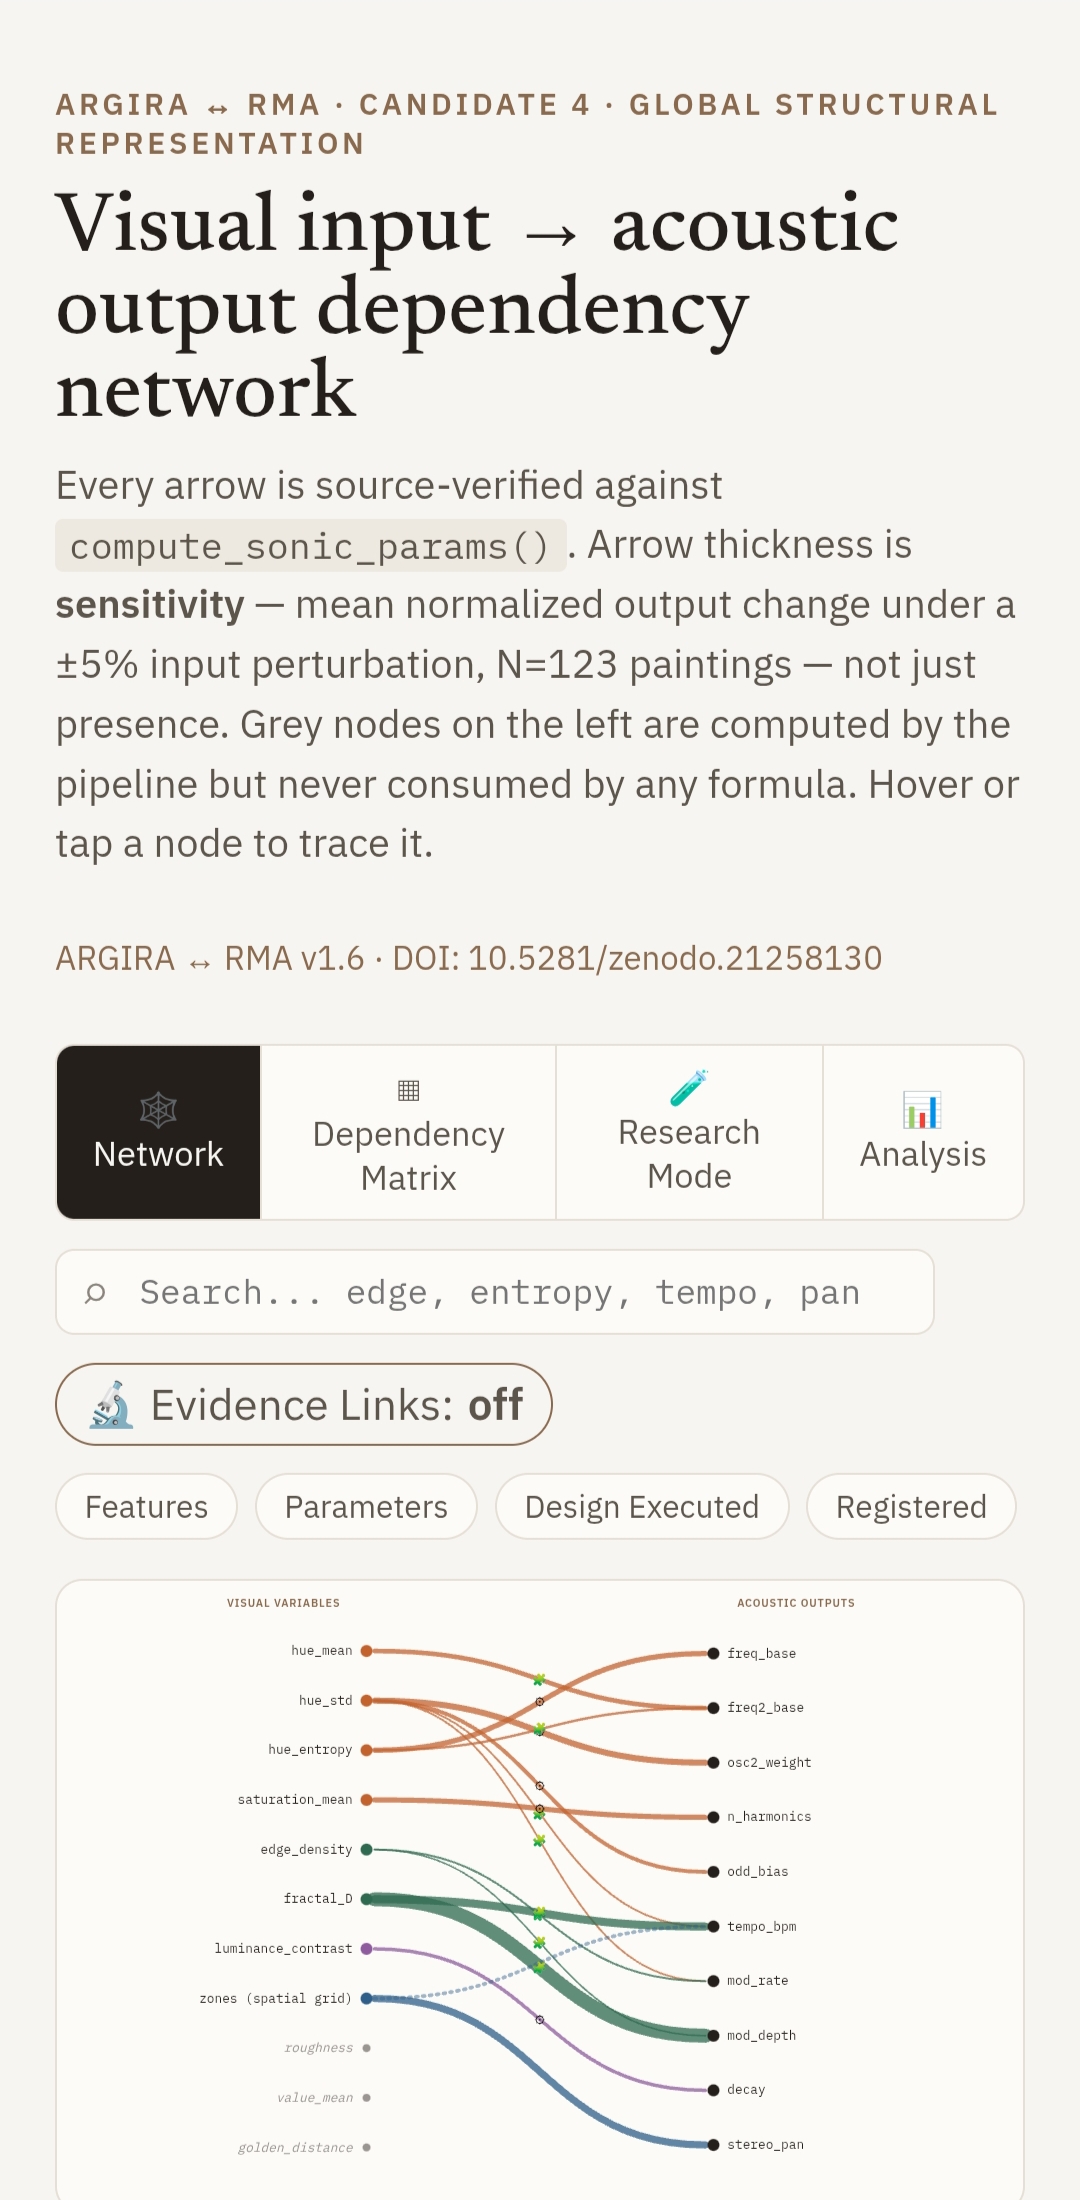
One of the central parts of the Explorer is the Design Graph. This graph represents how a visual feature travels through the pipeline to become an acoustic parameter — for example, a color property may feed a pipeline function, which generates a specific acoustic parameter.
The network makes it possible to answer questions such as:
Where does this parameter come from?
What variables affect it?
Is it a direct or derived relationship?
Is there evidence of sensitivity?
The intention is to eliminate the black box. Instead of seeing only image → sound, we can study the entire intermediate path.
Design Graph real del Explorer (v1.6)
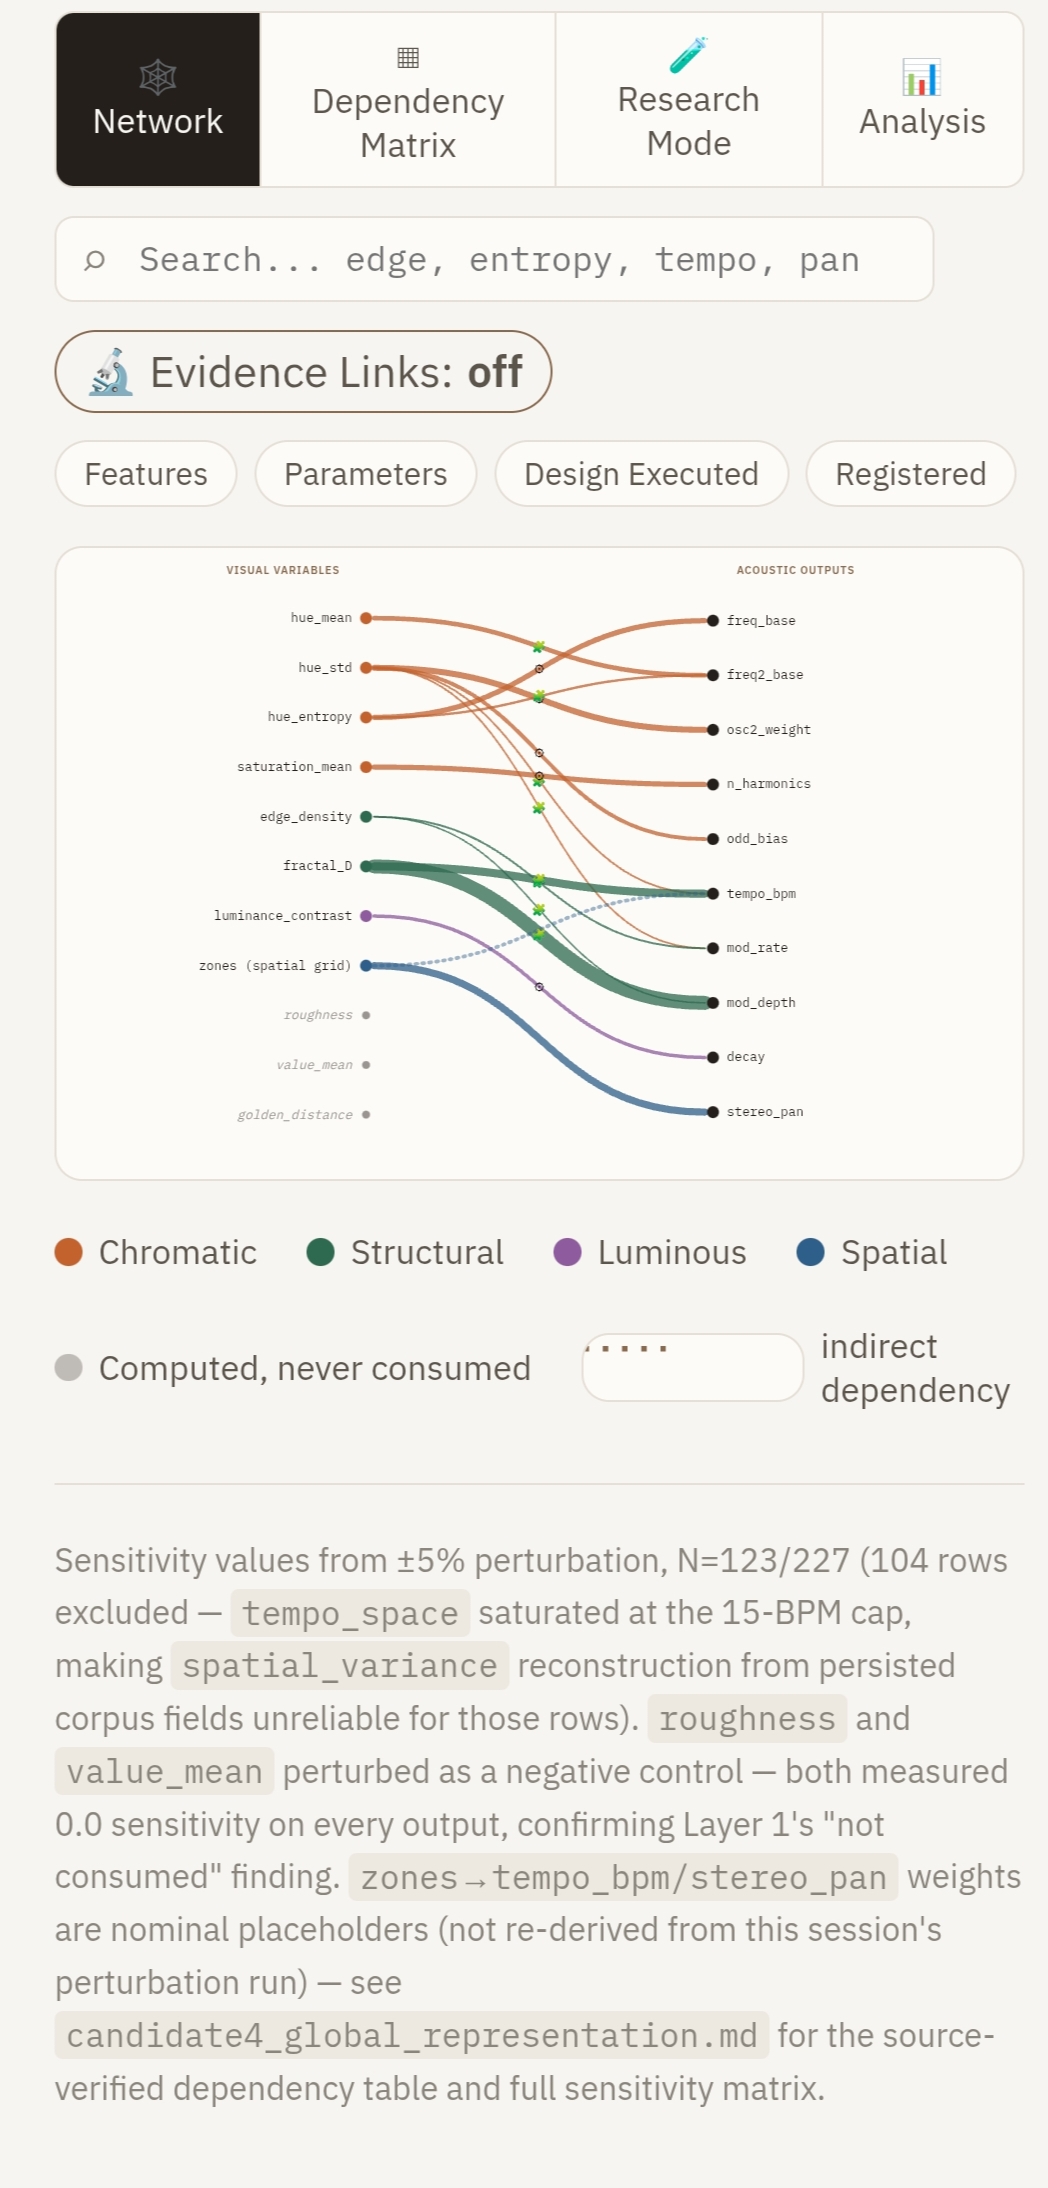
Grosor de línea = sensibilidad ante perturbación ±5% (ver bloque 4, "Sensitivity Evidence"). La conexión más gruesa del grafo es fractal_D → mod_depth (14.2), la mayor sensibilidad medida en todo el sistema. Nodos en gris (roughness, value_mean, golden_distance) son features sin conexión marcada o de menor peso relativo.
8. The node inspector: traceability
Every element in the graph can be inspected. The system shows:
name
category
unit
range
source function or module
validation status
This turns each variable into a traceable object. We not only know which variable exists, but also what role it plays within the system.
9. Reproducibility
Another fundamental objective was that the work could be inspected by others. That is why the artifact includes:
the complete application
the corpus dataset
CSV templates
analysis examples
HTML and PDF reports
graph export
The main file contains everything needed to explore the system without installing a server or manually rebuilding the environment.
10. Final idea
ARGIRA began as a sonification system for paintings. But with RMA, it became something different: an instrument for studying what happens when a representation changes domains.
The question is no longer just how to convert an image into sound? The question is:
What structure, what information, and what relationships survive when an image is transformed into an acoustic experience?
The Knowledge Explorer makes this process visible and allows it to be studied in a reproducible, auditable manner, open to further research.
Technical explanation for researchers
The technical version
1. System overview
ARGIRA ↔ RMA is a reproducible architecture for studying cross-modal transformations between visual representation and acoustic representation. The system consists of two main components:
ARGIRA: a deterministic visual-to-acoustic sonification pipeline.
RMA (Residual Model Auditor): a framework for auditing what structural information remains after the mapping.
The goal is not merely to generate an acoustic output from a visual input, but to analyze the informational structure of the transformation. Formally:
X = visual features extracted from the image
Y = acoustic parameters generated by ARGIRA
The system studies:
X → f(X) = Y
and subsequently analyzes whether a class of models g(X) can fully explain the relationship:
Y ≈ g(X)
The difference:
R = Y − g(X)
defines the residual that RMA audits.
2. ARGIRA pipeline
ARGIRA starts with an image. The system extracts visual features representing different dimensions of the artwork:
color statistics
chromatic distribution
entropy
edge density
spatial complexity
fractal dimension
features derived from spatial partitioning
These variables enter the sonification pipeline, which transforms them through explicit functions into acoustic parameters:
base frequency
harmonic components
oscillator weights
modulation
envelope
tempo
spatial position
The architecture maintains a clear separation between: input data, transformations, generated parameters, and acoustic output.
3. Design Graph
The Design Graph represents the computational structure of the pipeline. It is not a manually generated conceptual graph, but a dependency representation extracted from the actual system.
Each node represents an element of the process:
visual feature
intermediate variable
acoustic parameter
functional component
Each edge represents a dependency. This allows inspection of:
which inputs produce each output
which variables are central
which parameters depend on multiple sources
where direct or derived transformations exist
The goal is to provide structural interpretability.
4. Sensitivity Evidence
The graph relationships are complemented with sensitivity evidence. Sensitivity is obtained through controlled perturbations: ±5% on input variables.
The acoustic output variation is observed in response to these perturbations. The thickness of an edge does not merely represent the existence of a relationship, but the magnitude of response under a defined perturbation. This makes it possible to distinguish present relationships from relationships with quantifiable impact.
5. Residual Model Auditor (RMA)
RMA evaluates whether a modeling hypothesis fully captures a transformation. The general procedure:
Select a target acoustic variable Y.
Define explanatory variables X.
Fit a model g(X).
Obtain predictions via cross-validation.
Compute out-of-sample residuals.
Evaluate whether those residuals retain structure.
The use of cross-validated predictions is essential because it avoids misinterpreting in-sample overfitting patterns as real information.
6. Residual predictability
The core metric is the ability to predict the residuals.
no structure if residual R² ≈ 0 → the remaining information shows no recoverable structure under the model used.
predictable if residual R² > 0 → there is unexplained structure.
This does not automatically mean that a new phenomenon exists. It means that there is information that the model hypothesis does not capture. Interpretation requires further analysis.
7. End-to-end case study: tempo_bpm ~ fractal_D, hue_std
To illustrate the procedure from the previous section with an actual Explorer result, this section audits a specific relationship extracted from sonificacion_resultados.csv (n = 227 images).
Modeling hypothesis. We ask whether the generated tempo (tempo_bpm) is explained by a linear model based on two visual features: fractal dimension (fractal_D) and hue standard deviation (hue_std).
Parameter
Value
target
tempo_bpm
features
fractal_D, hue_std
model
linear
cv_strategy
kfold
n_total / n_clean
227 / 227
coverage
0.7127
residual R²
0.1905
residual_std
0.0639
IBDS
0.2441
Collinearity. The VIF for both features is 1.042, meaning fractal_D and hue_std provide essentially independent information: the result is not an artifact of predictor redundancy.
Reading the result. coverage = 0.7127 indicates that the linear model explains a substantial fraction of tempo_bpm. However, residual R² = 0.1905 shows that, even after this fit, the residual R = Y − g(X) retains recoverable structure under cross-validation — it is not flat noise. According to the criterion in Section 6, this classifies the relationship as:
partial structure the linear model captures part of the relationship but leaves a predictable residual: there is information that fractal_D and hue_std alone do not explain.
Robustness via bootstrap. The 95% bootstrap confidence interval (10 valid samples) on the residual R² is [0.3839, 0.6368], with a mean of 0.4847. With 0 excluded, the CI supports that the residual signal is likely real and not an effect of a particular cross-validation fold — the finding is a reasonable candidate for further investigation, not definitive confirmation.
Fragmento del Design Graph: la arista auditada
Recorte del grafo completo (ver vista 10 min, bloque 7) mostrando solo las dos aristas relevantes para este caso. fractal_D → tempo_bpm tiene grosor 8.23 frente a 1.90 de hue_std → tempo_bpm: la dimensión fractal domina la relación estructural, pero ninguna de las dos, combinadas linealmente, agota la información — de ahí el residual R² > 0.
Note: this report was automatically generated from the 📊 Analysis tab of the Explorer (rma_core.py via Pyodide, orchestrated by analysis_bridge.js) and preserved as raw JSON without reinterpretation, following the Evidence/Research/Analysis separation described below.
8. Evidence / Research / Analysis separation
The architecture incorporates an explicit separation between epistemological states.
Layer
Characteristics
Evidence
read-only · known provenance · not modifiable by exploration
Research
question generation · pattern searching · does not constitute evidence
Analysis
local results · reproducible · not automatically promoted
This separation prevents mixing exploration with confirmation.
9. Explorer architecture
The Explorer is a self-contained HTML application. It includes:
visual interface
interaction logic
embedded corpus
executable statistical engine via Pyodide
export system
The user can open the file, inspect the architecture, run analyses, and export results. No external infrastructure is required.
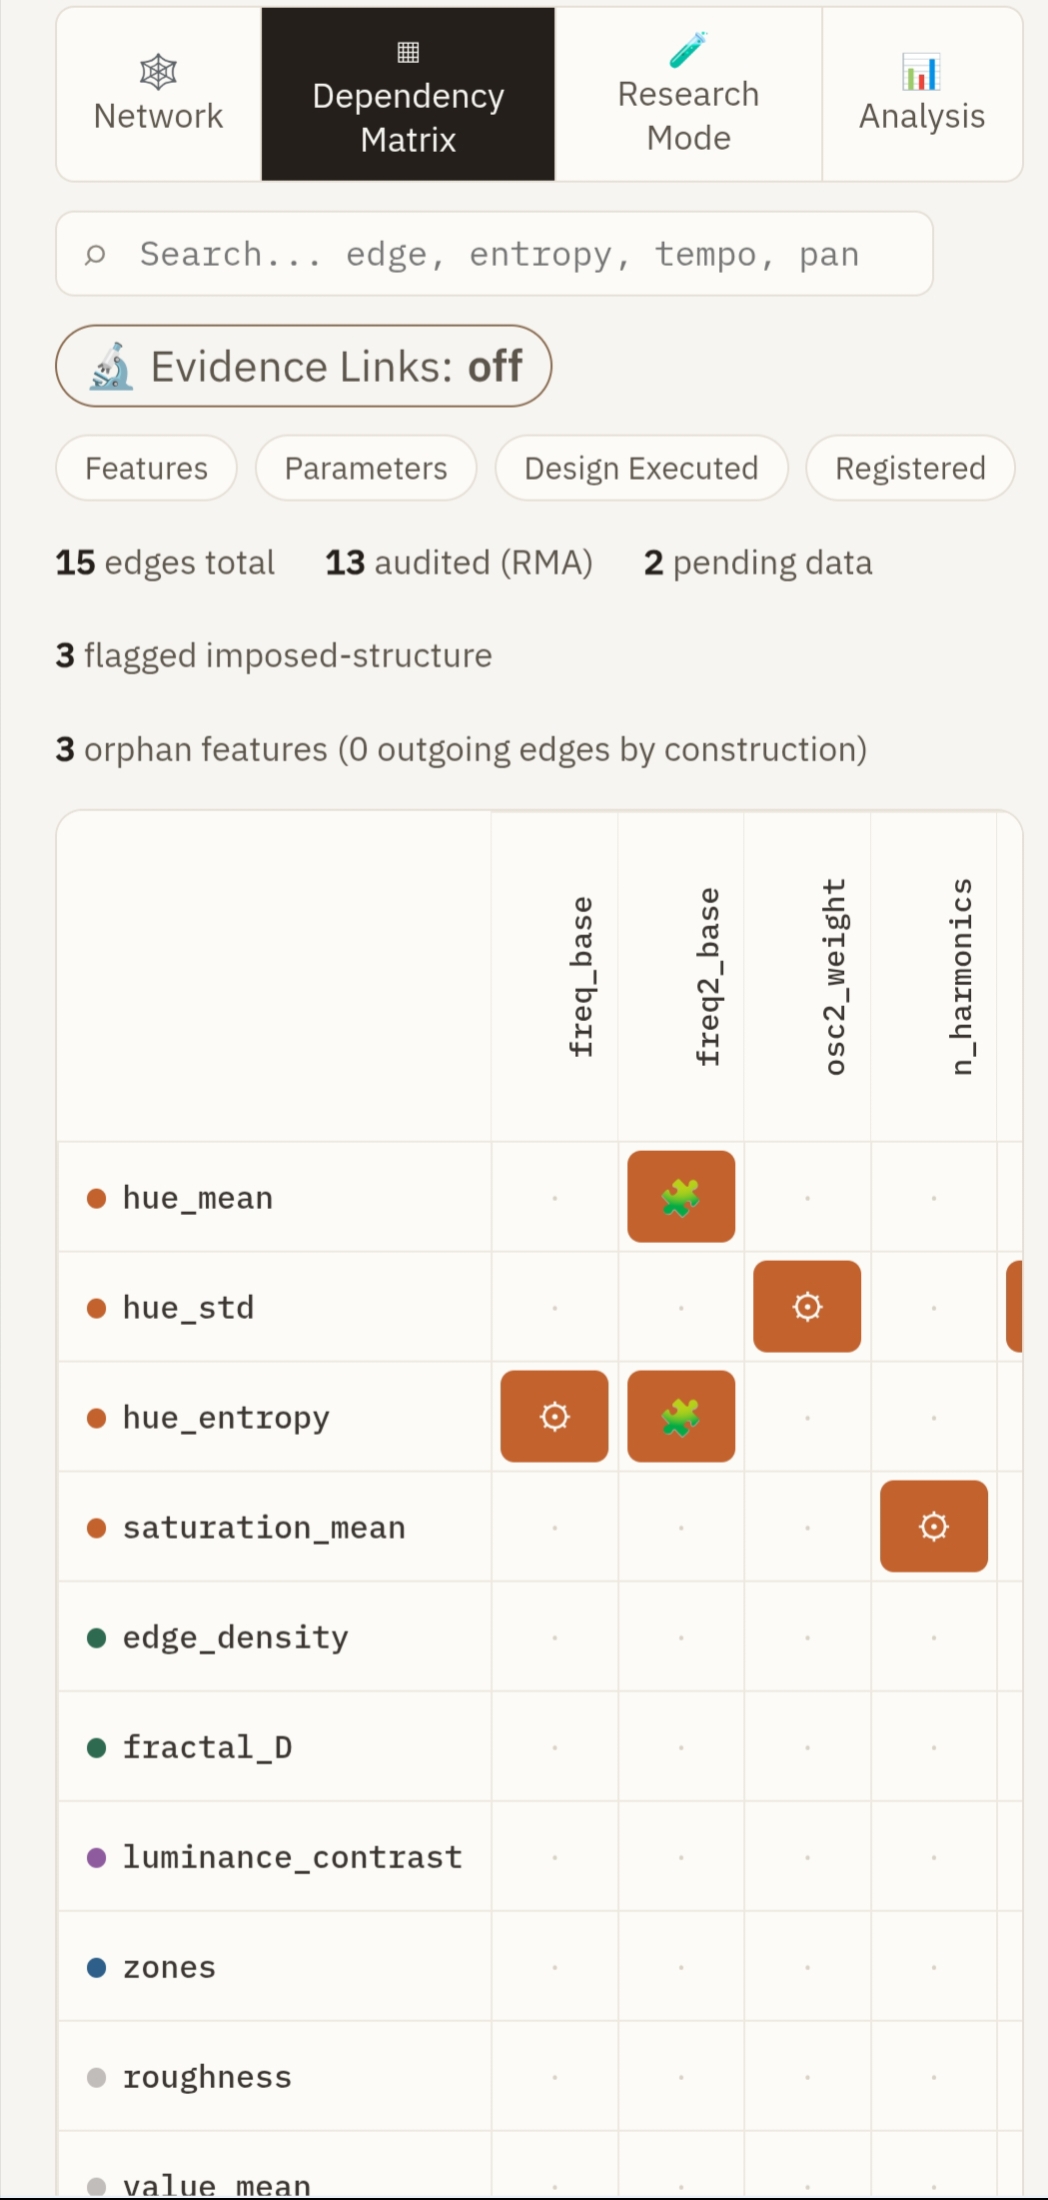
Captura real del Explorer — pestaña ▦ Dependency Matrix
Vista real de la interfaz: barra de pestañas (Network, Dependency Matrix, Research Mode, Analysis), buscador, toggle "Evidence Links: off" y la matriz feature × parámetro (15 edges total, 13 auditados con RMA, 2 pendientes de datos, 3 marcados como estructura impuesta).
Each stage maintains an explicit relationship with the next. This allows auditing not only results, but also the path that produces them.
11. Scientific interpretation
ARGIRA ↔ RMA does not attempt to claim that a perfect translation exists between image and sound. The goal is to study the properties of a cross-modal transformation:
what information is preserved
what information disappears
what information remains hidden to simple models
what structures emerge after the mapping
The methodological contribution is to provide a framework where an artistic transformation can be analyzed as an auditable computational system.
In that sense, ARGIRA ↔ RMA functions as a bridge between sonification, statistical analysis, scientific reproducibility, and model auditing.
Note: the technical explanation reveals something that might not be obvious when looking at the HTML: the real product is not the file. The file is the container. The intellectual product is the audit architecture of a visual-to-acoustic transformation.
Herramienta de referencia personal
Mapa maestro
No es una explicación para otros, sino algo que puedas mirar y decir "ahora entiendo qué es cada pieza y cómo encaja".
A. La pregunta central
¿Qué información de una imagen sobrevive cuando una transformación la convierte en sonido?
Pregunta: ¿queda información recuperable en el residuo?
D. El explorador — Knowledge Explorer
Es la ventana para estudiar todo. Tiene cuatro grandes funciones:
Ver — Network → "¿Cómo está conectado el sistema?"
Entender — Inspector → "¿Qué es cada elemento y de dónde viene?"
Separar conocimiento — Evidence / Research → "¿Qué sé y qué estoy investigando?"
Experimentar — Analysis → "¿Qué ocurre si pruebo nuevos modelos o datos?"
E. La filosofía del proyecto
No es:
"Una IA que convierte cuadros en música."
Eso sería una descripción superficial.
Es:
"Un marco para estudiar la conservación y pérdida de información durante una transformación entre dominios."
F. Las grandes preguntas abiertas
Aquí empieza la verdadera investigación:
¿Qué características visuales son más estables después del mapeo?
¿Qué parámetros acústicos conservan más información?
¿Cuándo un residuo representa una limitación del modelo y cuándo una propiedad emergente?
¿Qué relaciones sobreviven a validaciones perceptuales humanas?
¿Puede una representación sonora transmitir estructuras visuales sin acceso visual directo?
Guía pestaña por pestaña · v1.6
Guía del Knowledge Explorer
El Explorer real (v1.6) tiene 4 pestañas de nivel superior: 🕸 Network, ▦ Dependency Matrix, 🧪 Research Mode y 📊 Analysis. Esta guía conserva 6 bloques de contenido porque dos de esas pestañas agrupan más de una función: Dependency Matrix cubre tanto el Inspector de nodo como la vista Evidence, y Analysis cubre tanto la ejecución RMA como la exportación de informes. Cada bloque indica a qué pestaña real pertenece.
Introducción
El ARGIRA ↔ RMA Knowledge Explorer es una aplicación web autocontenida diseñada para explorar, auditar y analizar la relación entre características visuales de pinturas y parámetros acústicos generados por el pipeline ARGIRA.
El Explorer organiza el conocimiento en tres niveles conceptuales, repartidos entre sus 4 pestañas:
Pestaña real del Explorer: 🕸 Network (mapeo directo, sin agrupar).
Objetivo: la vista Network muestra el grafo de dependencias del sistema ARGIRA.
¿Cómo llega una característica visual hasta un parámetro acústico?
Qué muestra: cada nodo representa un elemento del sistema (característica visual, variable intermedia, parámetro acústico, componente del pipeline). Las conexiones representan relaciones dentro de la arquitectura.
Cómo leerlo:
hue_std ↓ función ARGIRA ↓ freq_base_hz
Interpretación: la variabilidad del color participa en la generación de un parámetro acústico concreto.
Qué buscar:
nodos centrales
parámetros con múltiples entradas
relaciones directas e indirectas
componentes con evidencia de sensibilidad
Grafo real: ver vista 10 min, bloque 7 "La red de dependencias"
El grafo completo (nodos, conexiones, categorías visual/acústico, grosor = sensibilidad ±5%) está embebido en la vista 10 min. Aquí se resume: hay 11 features visuales y 10 parámetros acústicos; la conexión más sensible es fractal_D → mod_depth (grosor 14.2).
Captura real — pestaña Network, cabecera y grafo completo (abrir imagen)Captura real — pestaña Network, vista con título y leyenda (abrir imagen)
Pestaña 2 — Node Inspector
Pestaña real del Explorer: ▦ Dependency Matrix (el Inspector es la función de detalle-de-nodo dentro de esta pestaña, no una pestaña independiente).
Objetivo: el Inspector convierte cada elemento del grafo en un objeto trazable. No solamente muestra el nombre de una variable, sino su contexto dentro del sistema.
Información disponible por nodo:
nombre
categoría
unidad
rango
origen
función o módulo responsable
estado de validación
Ejemplo: variable fractal_D → representa una medida de complejidad estructural; procede del análisis visual; participa en determinadas transformaciones acústicas.
Importancia científica: permite responder "¿De dónde sale este valor?" y "¿Por qué esta variable participa en este resultado?"
Campo
Valor real (nodo fractal_D)
nombre
fractal_D
categoría
visual
rango observado
1.1161 – 2.0000 (n=227, media 1.732)
origen
análisis visual de la pintura
conexión más sensible
fractal_D → mod_depth (grosor 14.2, la más alta del grafo)
estado de validación
usado como feature en RMA validado (VIF 1.042, sin colinealidad problemática)
Cifras extraídas directamente del dataset real sonificacion_resultados.csv (227 filas) y del grafo de dependencias exportado por el Explorer.
Captura real — pestaña Dependency Matrix (abrir imagen)
Pestaña 3 — Matrix / Evidence
Pestaña real del Explorer: ▦ Dependency Matrix (misma pestaña que el Inspector; Evidence es la vista de matriz/relaciones auditadas dentro de ella).
Objetivo: mostrar relaciones que forman parte de la evidencia auditada. Esta zona representa conocimiento confirmado.
Principio fundamental: explorar el sistema no modifica la evidencia. Los resultados validados permanecen separados de los experimentos.
Qué contiene: relaciones verificadas, resultados de auditorías previas, matrices de dependencia.
Cómo interpretarlo: una relación visible en Evidence significa "esta conexión ha pasado por un proceso de validación definido".
No significa "todas las relaciones posibles están demostradas".
Campo
Valor real (caso tempo_bpm ~ fractal_D, hue_std)
relación
fractal_D, hue_std → tempo_bpm
tipo
RMA validado (kfold, n=227/227)
coverage
0.7127
residual_r2
0.1905 (IC bootstrap 0.3839–0.6368, excluye 0)
clasificación
estructura parcial
indicador de validación
VIF 1.042/1.042 — sin colinealidad; señal residual probablemente real
Esta fila corresponde a un resultado auditado y confirmado: ha pasado por validación cruzada y verificación de estabilidad (bootstrap CI), no a una hipótesis sin probar.
Pestaña 4 — Research
Pestaña real del Explorer: 🧪 Research Mode (mapeo directo, sin agrupar).
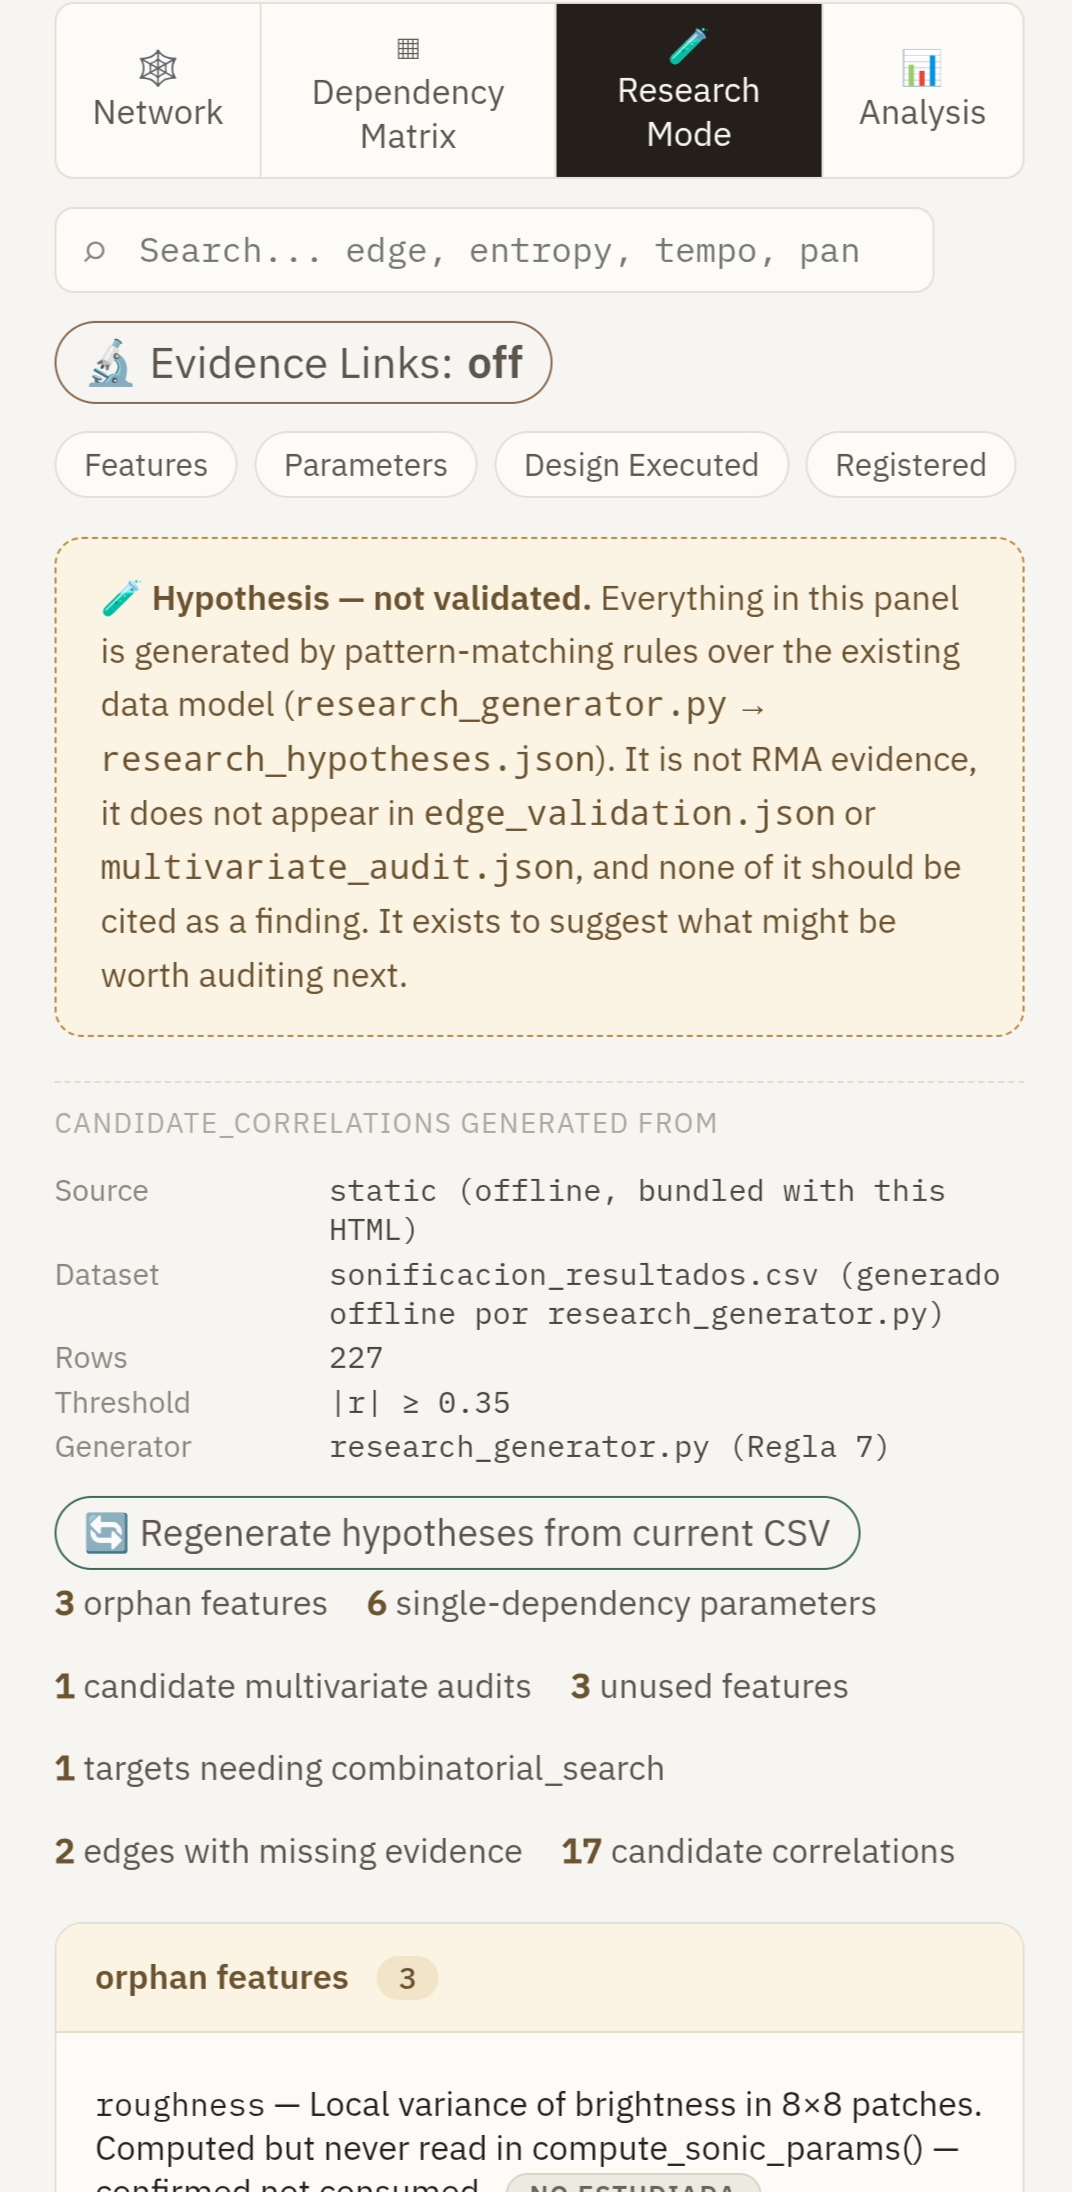
Objetivo: Research es el espacio de exploración científica. Su función es generar preguntas.
Importante: una hipótesis no es un resultado. Research permite estudiar patrones interesantes, posibles relaciones, preguntas futuras.
Ejemplo:
Observación: "Un parámetro acústico parece relacionarse con varias características visuales."
Pregunta: "¿Esta relación permanece bajo otros modelos o datasets?"
Eso pertenece a Research.
Flujo correcto:
Research ↓ Análisis adicional ↓ Validación independiente ↓ Evidence
Campo
Valor real (hipótesis derivada del caso auditado)
observación
tempo_bpm ~ fractal_D + hue_std deja un residual_r2 de 0.1905 no explicado, y el IC bootstrap (0.3839–0.6368) excluye 0
estado
exploratorio — todavía no es evidencia
pregunta
¿qué otra(s) feature(s) del dataset (p. ej. edge_density, roughness) explican ese residuo?
siguiente paso
ampliar el modelo con features adicionales y volver a correr RMA con validación cruzada
Hipótesis construida a partir del propio resultado auditado en Analysis/Evidence, sin introducir variables no observadas en el dataset real.
Captura real — pestaña Research Mode (abrir imagen)
Pestaña 5 — Analysis
Pestaña real del Explorer: 📊 Analysis (cubre tanto la ejecución del análisis como su exportación, ver también bloque 6).
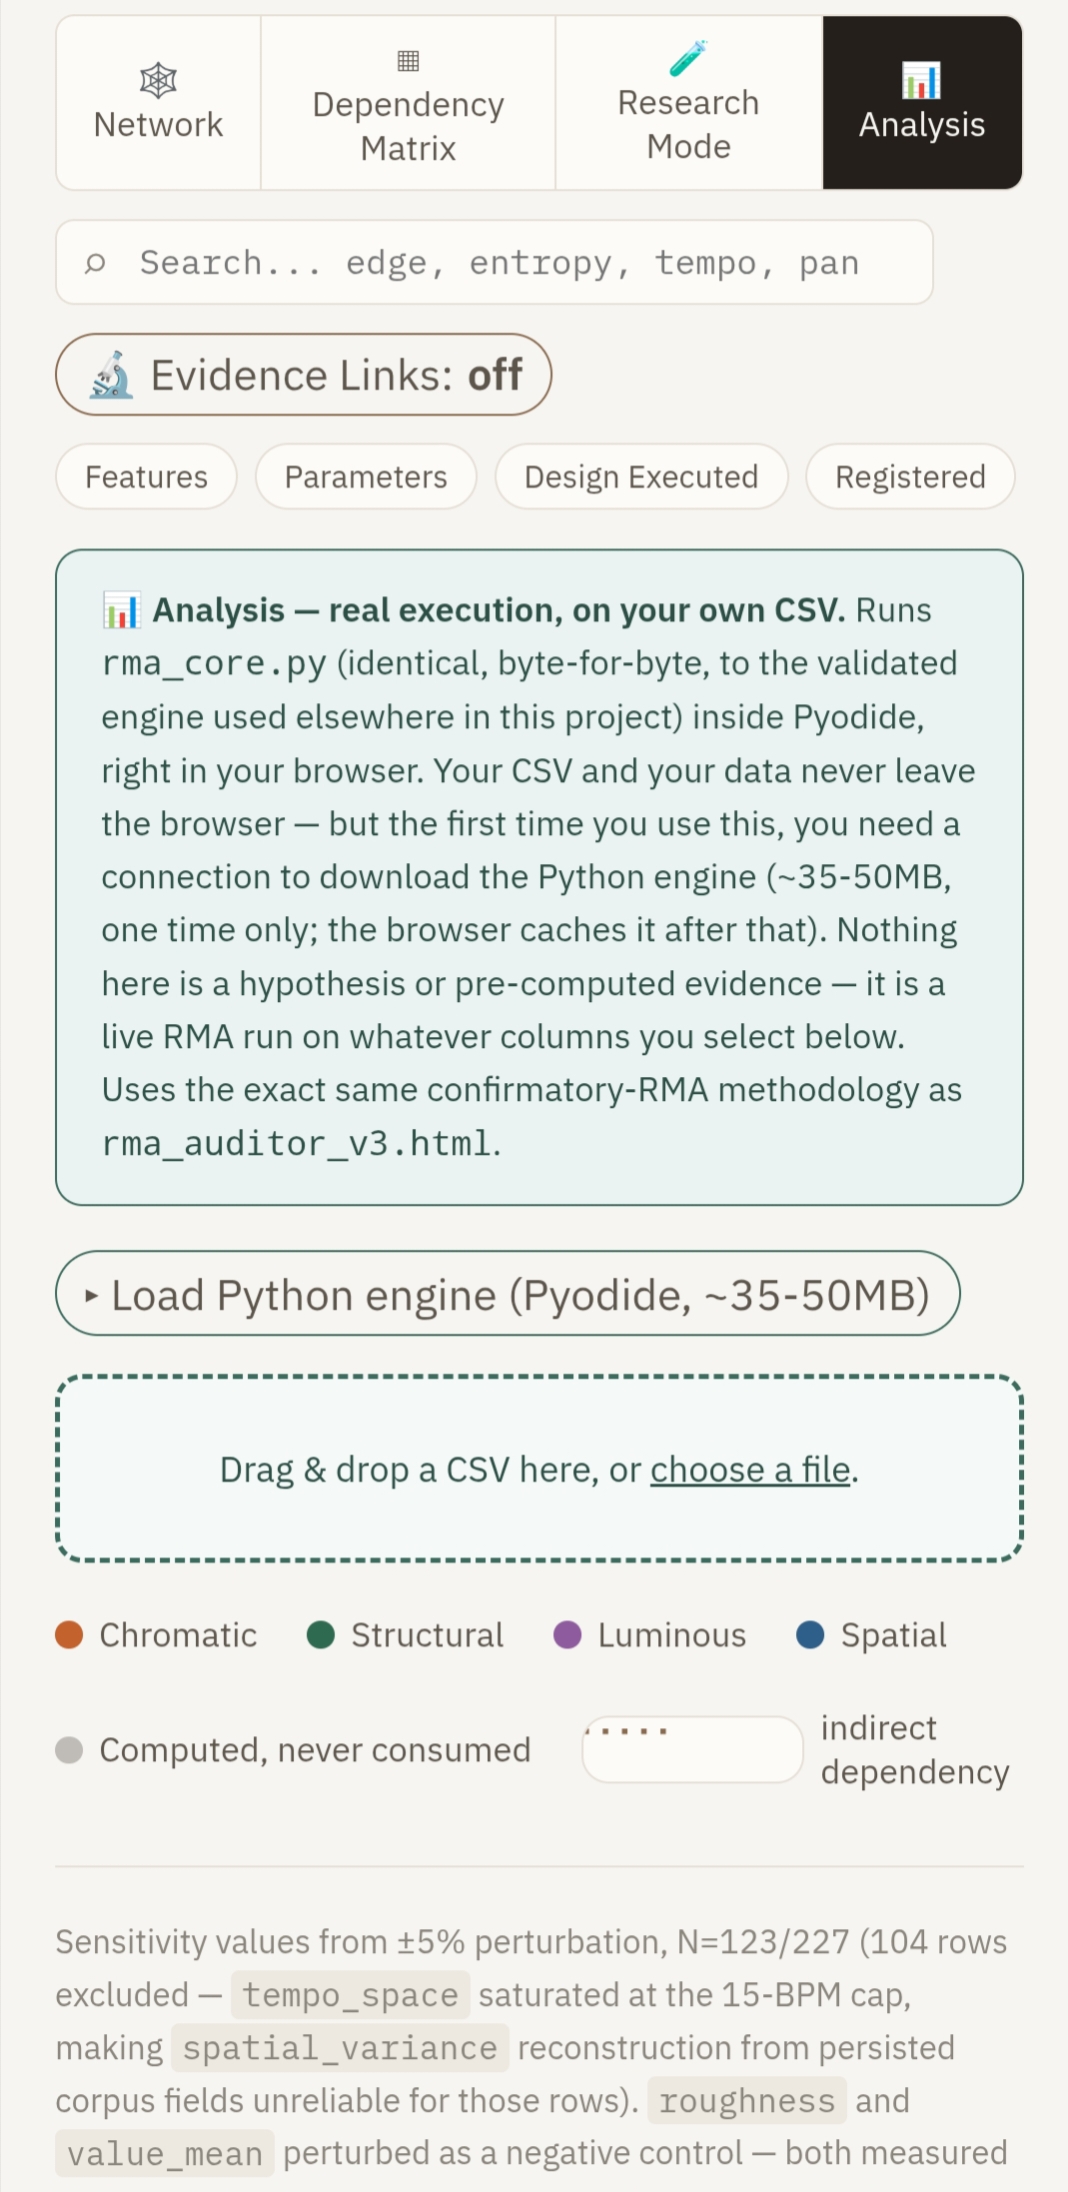
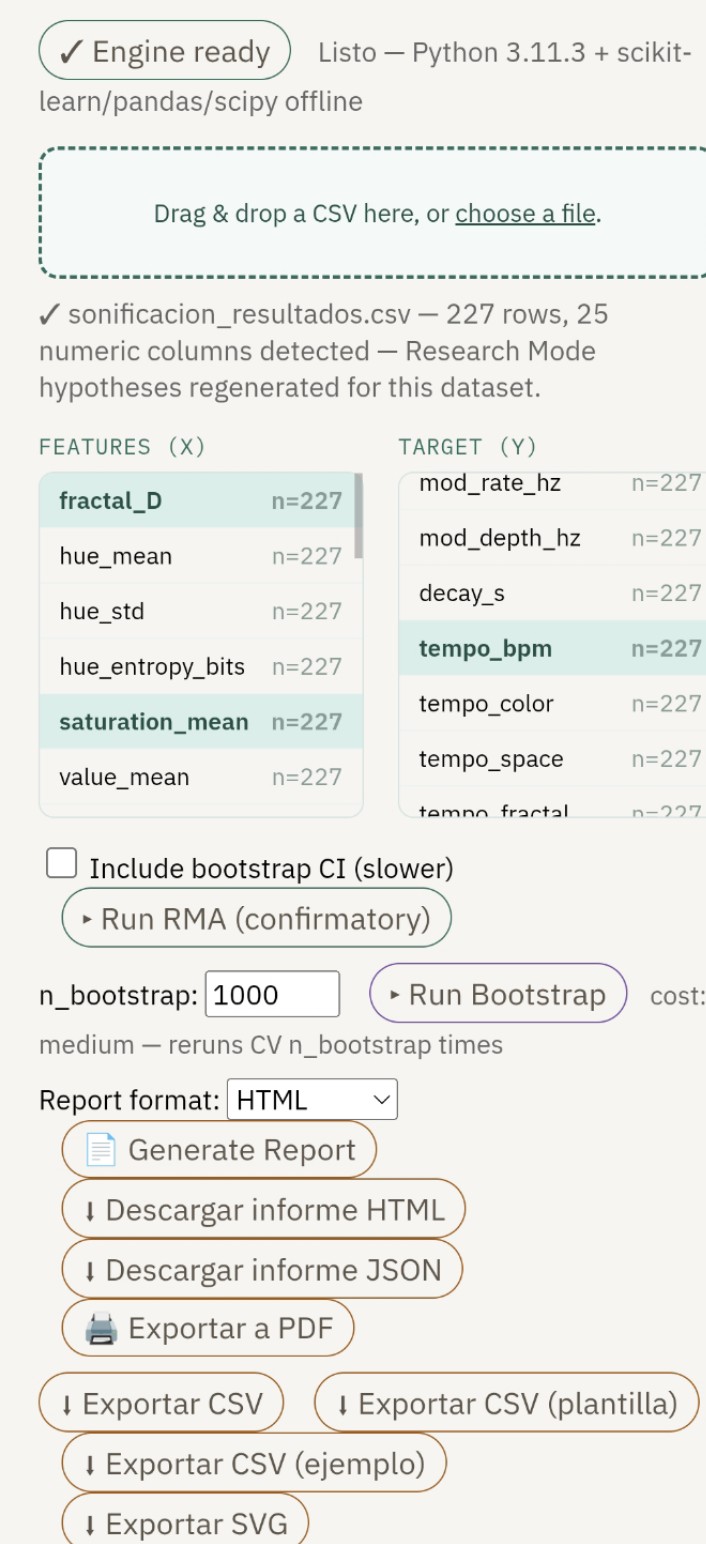
Objetivo: Analysis permite ejecutar RMA directamente. Es el laboratorio computacional del Explorer.
Entrada: el usuario puede utilizar el corpus integrado de ARGIRA o un CSV externo.
Qué estudia RMA: no solamente "¿Predice bien el modelo?", también "¿Qué información queda fuera de la explicación?"
Ejemplo: modelo tempo_bpm ~ fractal_D + hue_std. RMA evalúa: ajuste del modelo, residuos, estructura residual, estabilidad del resultado.
Parámetro
Valor real
target
tempo_bpm
features
fractal_D, hue_std
model
linear
cv_strategy
kfold
n_total / n_clean
227 / 227 (sin missing)
coverage
0.7127
residual_r2
0.1905
residual_std
0.0639
ibds
0.2441
VIF (fractal_D / hue_std)
1.042 / 1.042 — sin colinealidad problemática
clasificación
estructura parcial
Cifras extraídas directamente del informe RMA real generado por el Explorer (dataset sonificacion_resultados.csv, motor rma_core.py vía Pyodide). Ver caso de estudio completo, incluyendo el bootstrap CI del residual R², en la sección siguiente.
Captura real — pestaña Analysis, motor Pyodide en el navegador (abrir imagen)
Pestaña 6 — Reports / Export
Pestaña real del Explorer: 📊 Analysis (misma pestaña que el bloque 5; la exportación es el paso final del flujo de Analysis, no una pestaña aparte).
Objetivo: convertir una exploración en un objeto reproducible.
Exportaciones disponibles: HTML, PDF, JSON, CSV, SVG. Ejemplo real: el mismo informe tempo_bpm ~ fractal_D + hue_std exportado como HTML y como PDF (ver vista Técnica), con el bootstrap CI incluido en una versión y ausente en la otra según el momento de exportación.
Ejemplo: una persona puede ejecutar un análisis, exportar el informe, compartirlo, y revisar exactamente qué datos y parámetros utilizó.
Campo
Exportación 07:47:34
Exportación 07:50:31
formatos
HTML, PDF
HTML, PDF
residual_r2
0.1905
0.1905
bootstrap CI
ausente
presente (0.3839–0.6368, n=10)
advertencias
ninguna
1 (señal residual probablemente real)
Ejemplo real de trazabilidad: el mismo caso tempo_bpm ~ fractal_D + hue_std exportado tres minutos después incorpora el bootstrap CI del residual R², que aún no se había calculado en la primera exportación. Cada archivo (HTML/PDF) conserva el JSON crudo (source_result) para verificar exactamente qué cambió.
Captura real — panel de ejecución RMA y exportación (abrir imagen)
Ejemplo de recorrido completo
Un investigador quiere estudiar un parámetro acústico.
Abre Network → "¿Qué variables visuales influyen en este parámetro?"
Abre Inspector → "¿Cuál es el origen exacto de estas variables?"
Consulta Evidence → "¿Qué relaciones ya están auditadas?"
Explora Research → "¿Qué hipótesis nuevas aparecen?"
Ejecuta Analysis → "¿Qué ocurre bajo un análisis estadístico reproducible?"
Exporta resultados → "¿Puedo compartir este análisis?"
Idea central del Explorer
El Explorer no es solamente una interfaz gráfica. Es una capa de transparencia sobre una transformación compleja: